Breathe easier with the Google Air Quality API
How to use the Google Air Quality API to show real time AQI, map overlays, and global insights for health and travel apps.

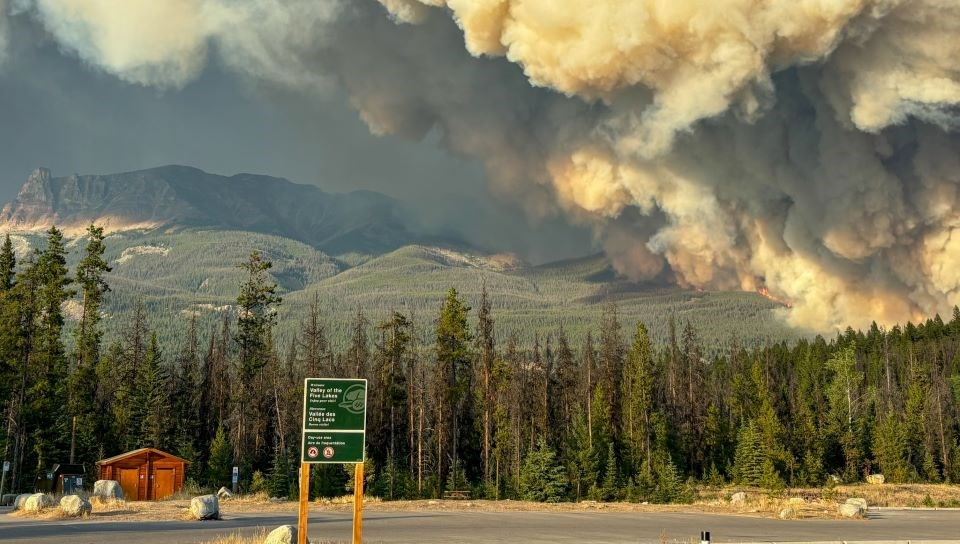
Last summer, I found myself camping in a mountain pass near the town of Revelstoke, trapped between forest fires in Jasper National Park to the north and the town of Banff to the west. I was on day three of a week long camping vacation, and wanted to spend the rest of my trip somewhere smoke free. I didn't have much cell reception up in the mountains, but I was still able to fire up Google Maps and use its new air quality layer to pick out an area without any wildfire smoke. I changed my plans (the campground I was headed to in Jasper had burnt down) and made my way south to the mountain town of Fernie, British Columbia.
In this blog post, I’ll show you how to use the Google Air Quality API (which provides the same data and overlays that power Google Maps) to add real time air quality insights, health recommendations, and travel advice to your own apps.
Part 1: Breathe easier with the Google Air Quality API (this article)
Part 2: When trees attack! Build with the Google Pollen API
Part 3: Walking on sunshine: Fun with the Google Solar API
What is the Google Air Quality API?
The Google Air Quality API is a web service that gives you real time, forecasted and historical air quality information for a specific location. It returns 70+ AQI (Air Quality Index) standards, pollutant details e.g. PM2.5 or NOx, and heat map overlays. Coverage includes over 100 countries with a resolution of 500 x 500 meters.
Why does this matter? Climate change is already harming people’s health in many ways. In Western Canada, hotter summers dry out forests and vegetation, while heat waves lengthen the wildfire season, starting earlier in spring and stretching later into fall. These conditions have fueled a surge in wildfires, which in turn has hit the tourism industry hard. In British Columbia, bookings fell by 5 - 15% year on year in 2025, even in areas untouched by fire, because of heavy smoke and traveler uncertainty. Tourists are also making more last minute holiday plans or canceling trips altogether when fire risk or smoke is in the forecast.
Air quality APIs allow hotels and tour operators to seamlessly add this data to their websites and apps, helping guests make informed choices about where to stay and what activities to enjoy. For consumers, easy access to this data supports healthier daily decisions - such as whether to bike or drive to work, or if it’s safe to go for a run outside.
What can the Google Air Quality API do?
The API offers four main endpoints:
- Current Conditions: Provides detailed, real-time air quality data for a specific location.
- Forecast: Delivers up to 96 hours (4 days) of air quality forecasts, starting from the current day.
- History: Returns up to 30 days of past air quality data for a given location.
- Heatmap Tiles: Supplies air quality heatmaps as tile overlays for easy visualization on maps.
Google Air Quality API example
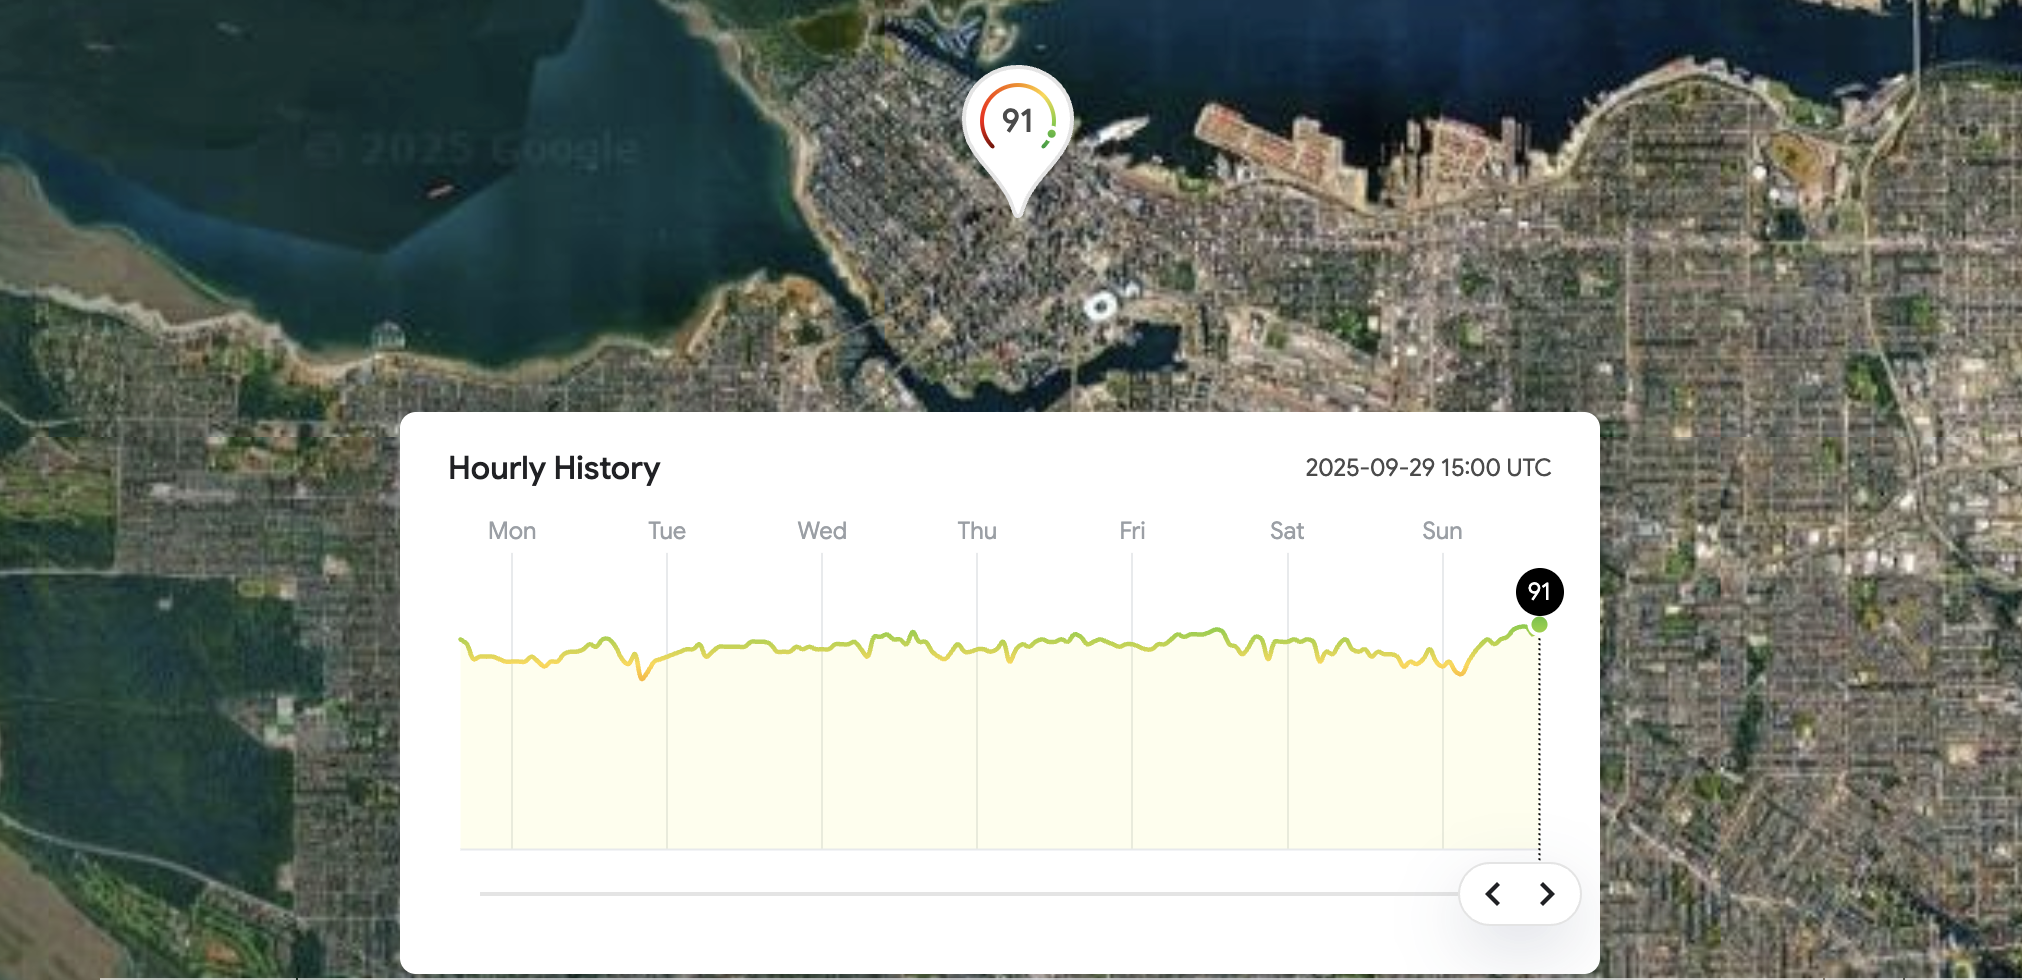
Here's a simple example that shows how to retrieve current, forecast and historical air quality information for Vancouver, Canada (49.246292, -123.116226).
Current Conditions
The Current Conditions endpoint provides current hourly air quality information.
Endpoint POST https://airquality.googleapis.com/v1/currentConditions:lookup?key={YOUR_API_KEY}
{YOUR_API_KEY} is your Google Maps API key.
Headers
Content-Type: application/json; charset=utf-8
Body
{
    "location": {
        "latitude": 49.246292,
        "longitude": -123.116226
    },
    "extraComputations": [
        "LOCAL_AQI",
        "HEALTH_RECOMMENDATIONS"
    ],
    "customLocalAqis": [
        {
            "regionCode": "CA",
            "aqi": "can_ec"
        }
    ]
}
The location parameter specifies the latitude and longitude where the API retrieves current air quality data.
extraComputations is an optional array that lets you request extra features. When you include it, the API adds additional data fields to the response based on what you asked for.
- "LOCAL_AQI" lets you include the local (national) AQI of the requested location (country) in the response. Must be paired with a valid
customLocalAqisfield. See Air Quality API supported countries and available AQIs. - "HEALTH_RECOMMENDATIONS" determines whether the response will include the health advice and recommended actions for the current AQI conditions.
- "DOMINANT_POLLUTANT_CONCENTRATION" adds the measured concentrations of the dominant pollutants to the API response.
customLocalAqis pairs a country or region with the desired AQI so that air quality data that is returned will be displayed according to the chosen AQI. This is important because local health agencies and governments (like Canada’s AQHI, the US AQI, or the EU’s CAQI) issue air quality alerts, guidance, and recommendations using their own national standards. Showing the local index helps users understand and act on health advice more easily.
Response
{
"dateTime": "2025-09-29T15:00:00Z",
"regionCode": "ca",
"indexes": [
{
"code": "can_ec",
"displayName": "AQHI (CA)",
"aqi": 1,
"aqiDisplay": "1",
"color": {
"green": 0.8,
"blue": 1
},
"category": "Low health risk",
"dominantPollutant": "no2"
},
{
"code": "uaqi",
"displayName": "Universal AQI",
"aqi": 89,
"aqiDisplay": "89",
"color": {
"red": 0.1882353,
"green": 0.6862745,
"blue": 0.21568628
},
"category": "Excellent air quality",
"dominantPollutant": "no2"
}
],
"pollutants": [
{
"code": "no2",
"displayName": "NO2",
"fullName": "Nitrogen dioxide",
"concentration": {
"value": 14.9,
"units": "PARTS_PER_BILLION"
}
}
],
"healthRecommendations": {
"generalPopulation": "With this level of air quality, you have no limitations. Enjoy the outdoors!",
//... 6 more health recommendations
}
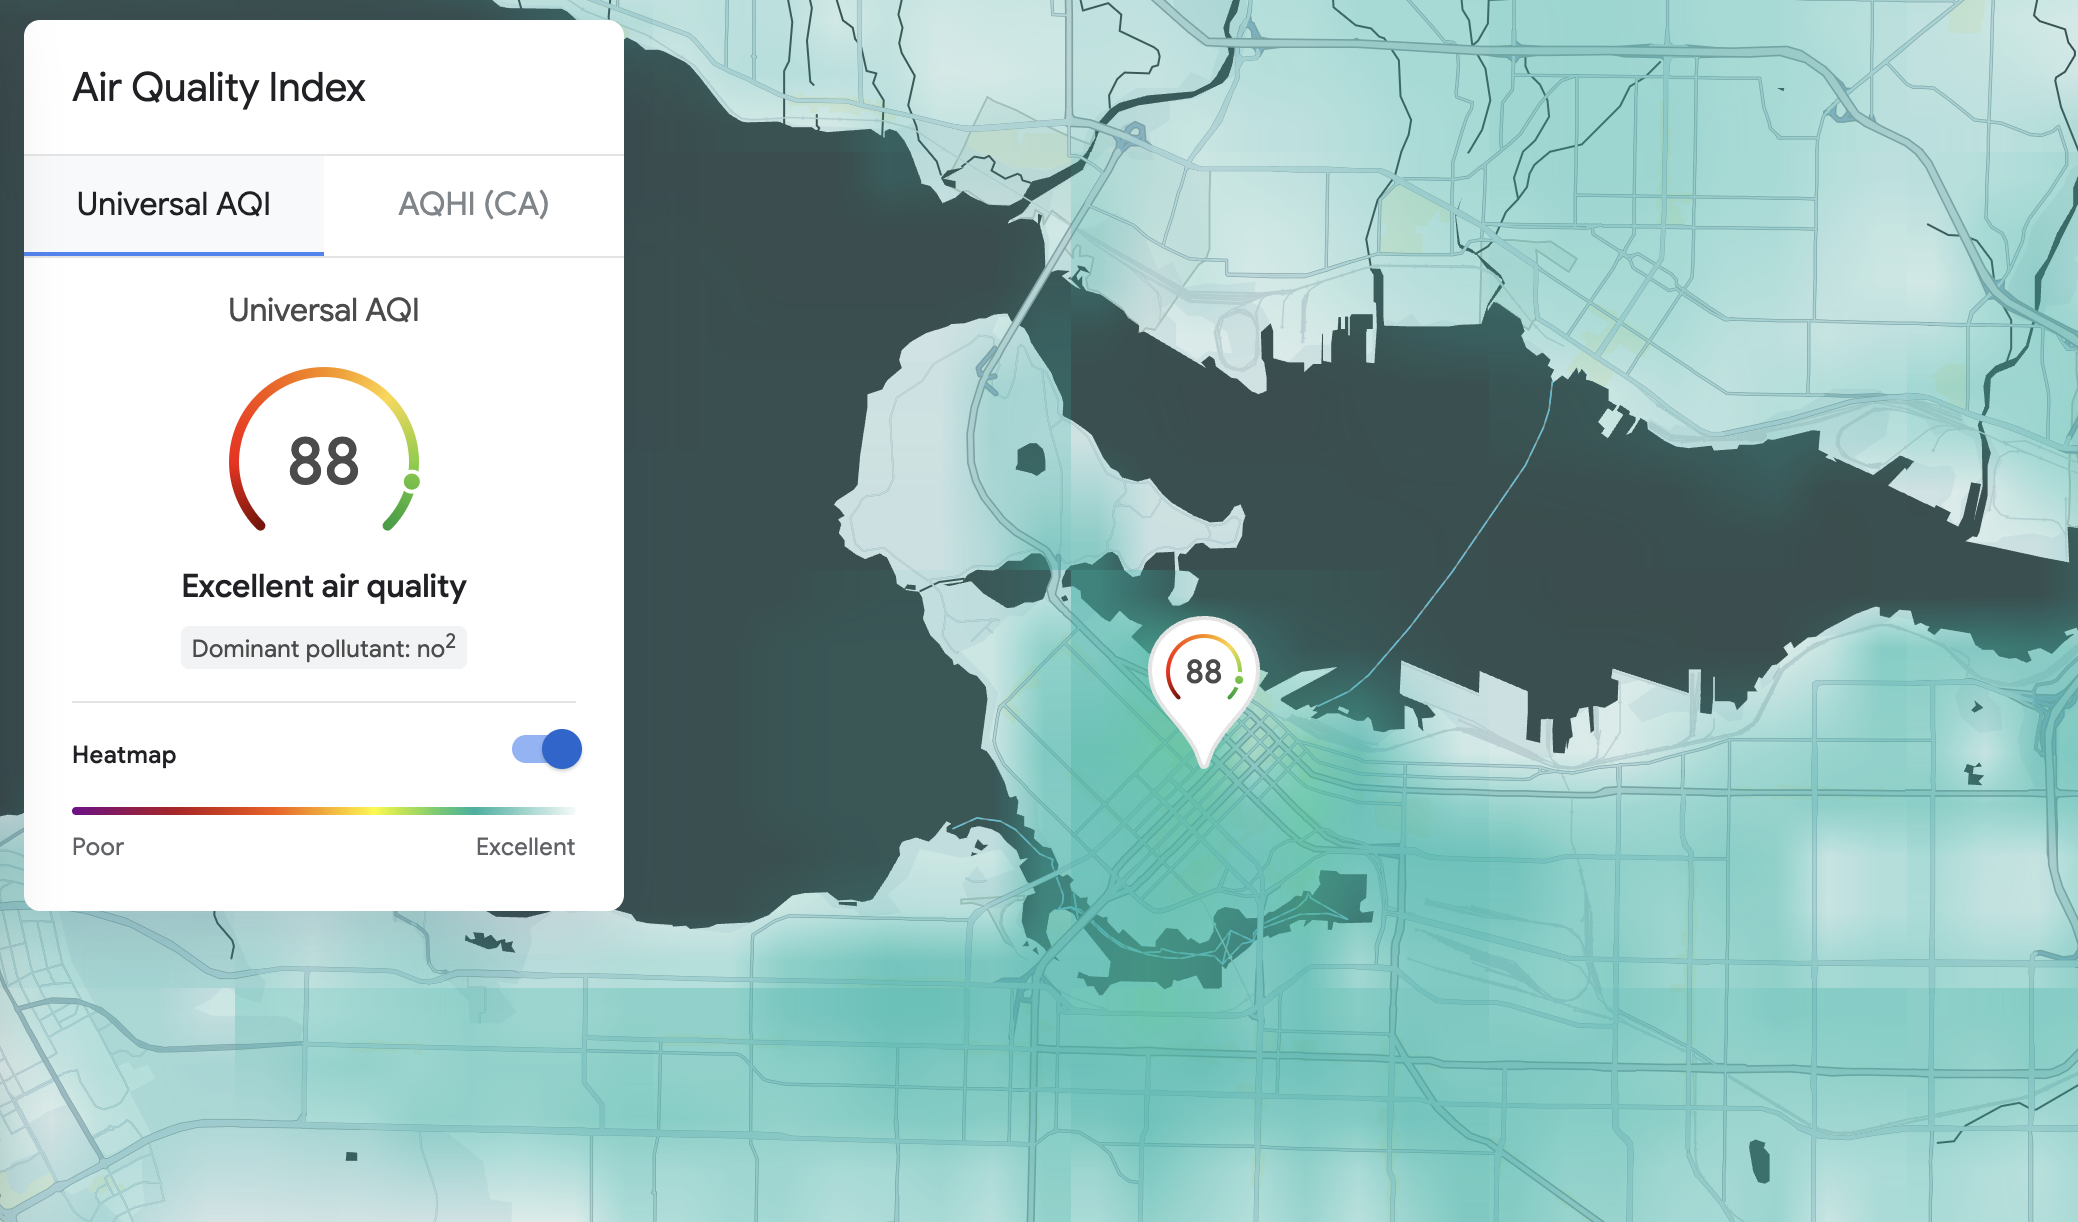
}The Air Quality API returns a clear and easy to understand response. indexes provides the AQI values for the specified location, together with its index code, color (the color used to represent the AQI numeric score) and numeric aqi value. An AQI, or Air Quality Index, is a scale used by government agencies - like the US EPA or Environment Canada - to assess how clean or polluted the air is, based on specific pollutants and national standards.
In the example above, Vancouver receives an AQHI rating of 1 (Canada’s index) and a UAQI rating of 89, both of which indicate excellent air quality with minimal health risks for outdoor activities.
pollutants contains information about the dominant pollutants in the area. This includes the displayName, fullName and concentration. For example, the response above indicates that the dominant pollutant in Vancouver is Nitrogen Dioxide or NO2, with a concentration of 14.9 ppb (parts per billion).
healthRecommendations provide guidance based on current air quality conditions. They include general advice for the public, along with specific recommendations for six at-risk groups who are more sensitive to air pollution than the general population.
Forecast
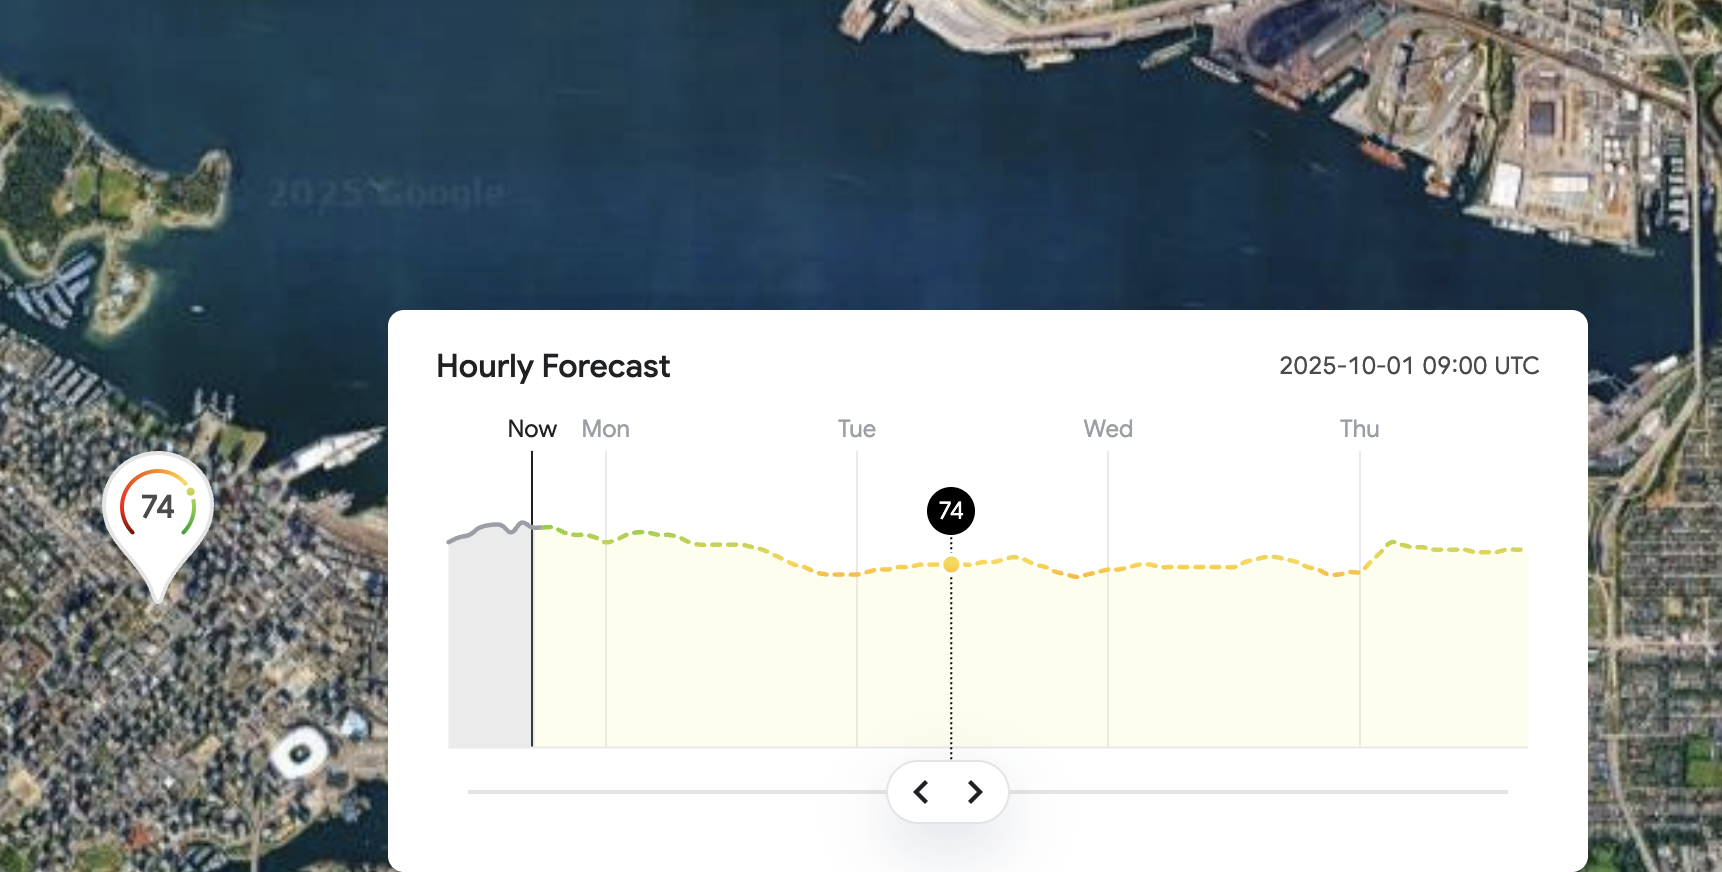
The Forecast endpoint provides up to 96 hours (4 days) of hourly air quality forecast information for a given location. Each forecast includes hourly air quality indexes as well as the same additional information you get from the Current Conditions endpoint.
You can either specify a dateTime to get the predicted air quality at a specific time, or a Time period for which to display air quality forecast information.
Endpoint POST https://airquality.googleapis.com/v1/forecast:lookup?key={YOUR_API_KEY}
{YOUR_API_KEY} is your Google Maps API key.
Headers
Content-Type: application/json; charset=utf-8
Body
{
  "location": {
    "latitude": 49.246292,
    "longitude": -123.116226
  },
  "dateTime": "2025-10-01T08:00:00Z"
}
Response
{
    "hourlyForecasts": [
        {
            "dateTime": "2025-10-01T08:00:00Z",
            "indexes": [
                {
                    "code": "uaqi",
                    "displayName": "Universal AQI",
                    "aqi": 74,
                    "aqiDisplay": "74",
                    "color": {
                        "red": 0.44705883,
                        "green": 0.78431374,
                        "blue": 0.2
                    },
                    "category": "Good air quality",
                    "dominantPollutant": "o3"
                }
            ]
        }
    ],
    "regionCode": "ca"
}
The response is an array of hourlyForecasts, each with the air quality index information payload for that hour. If you want more than one forecast, you can replace dateTime with a time range period in the request:
{
    "period": {
        "startTime": "2025-09-29T17:00:00Z",
        "endTime": "2025-09-29T20:00:00Z"
    }
}
If you get a "The specified time period is not supported" error, check that yourstartTime and endTime you specify fall within the next 96 hours, starting from the current time.
History
The History endpoint provides historical hourly air quality information for a specific location, for a given time range, up to a maximum of 30 days.
Endpoint POST https://airquality.googleapis.com/v1/history:lookup?key={YOUR_API_KEY}
{YOUR_API_KEY} is your Google Maps API key.
Headers
Content-Type: application/json; charset=utf-8
Body
{
  "location": {
    "latitude": 49.246292,
    "longitude": -123.116226
  },
  "period": {
        "startTime": "2025-09-25T00:00:00Z",
        "endTime": "2025-09-27T00:00:00Z"
    }
}
period indicates the startTime and endTime period for which to get the historical data (the timestamp is rounded to the previous exact hour). Instead of period, you could use the hours field. hours is a number from 1 to 720 that indicates the hours range for the request. For example: A value of 48 will yield data from the last 48 hours.
Response
{
    "hoursInfo": [
        {
            "dateTime": "2025-09-27T00:00:00Z",
            "indexes": [
                {
                    "code": "uaqi",
                    "displayName": "Universal AQI",
                    "aqi": 84,
                    "aqiDisplay": "84",
                    "color": {
                        "red": 0.27450982,
                        "green": 0.72156864,
                        "blue": 0.21176471
                    },
                    "category": "Excellent air quality",
                    "dominantPollutant": "pm10"
                }
            ]
        },
        //... 48 more entries
    ],
    "regionCode": "ca"
}
The response is an array, hoursInfo, that provides air quality data for each hour in a given time range, up to a maximum of 30 days.
Heatmap Tiles
The Heatmap Tiles endpoint provides air quality related heatmaps through a tile overlay.
Endpoint GET https://airquality.googleapis.com/v1/mapTypes/{TYPE}/heatmapTiles/{Z}/{X}/{Y}?key={YOUR_API_KEY}
{YOUR_API_KEY} is your Google Maps API key.
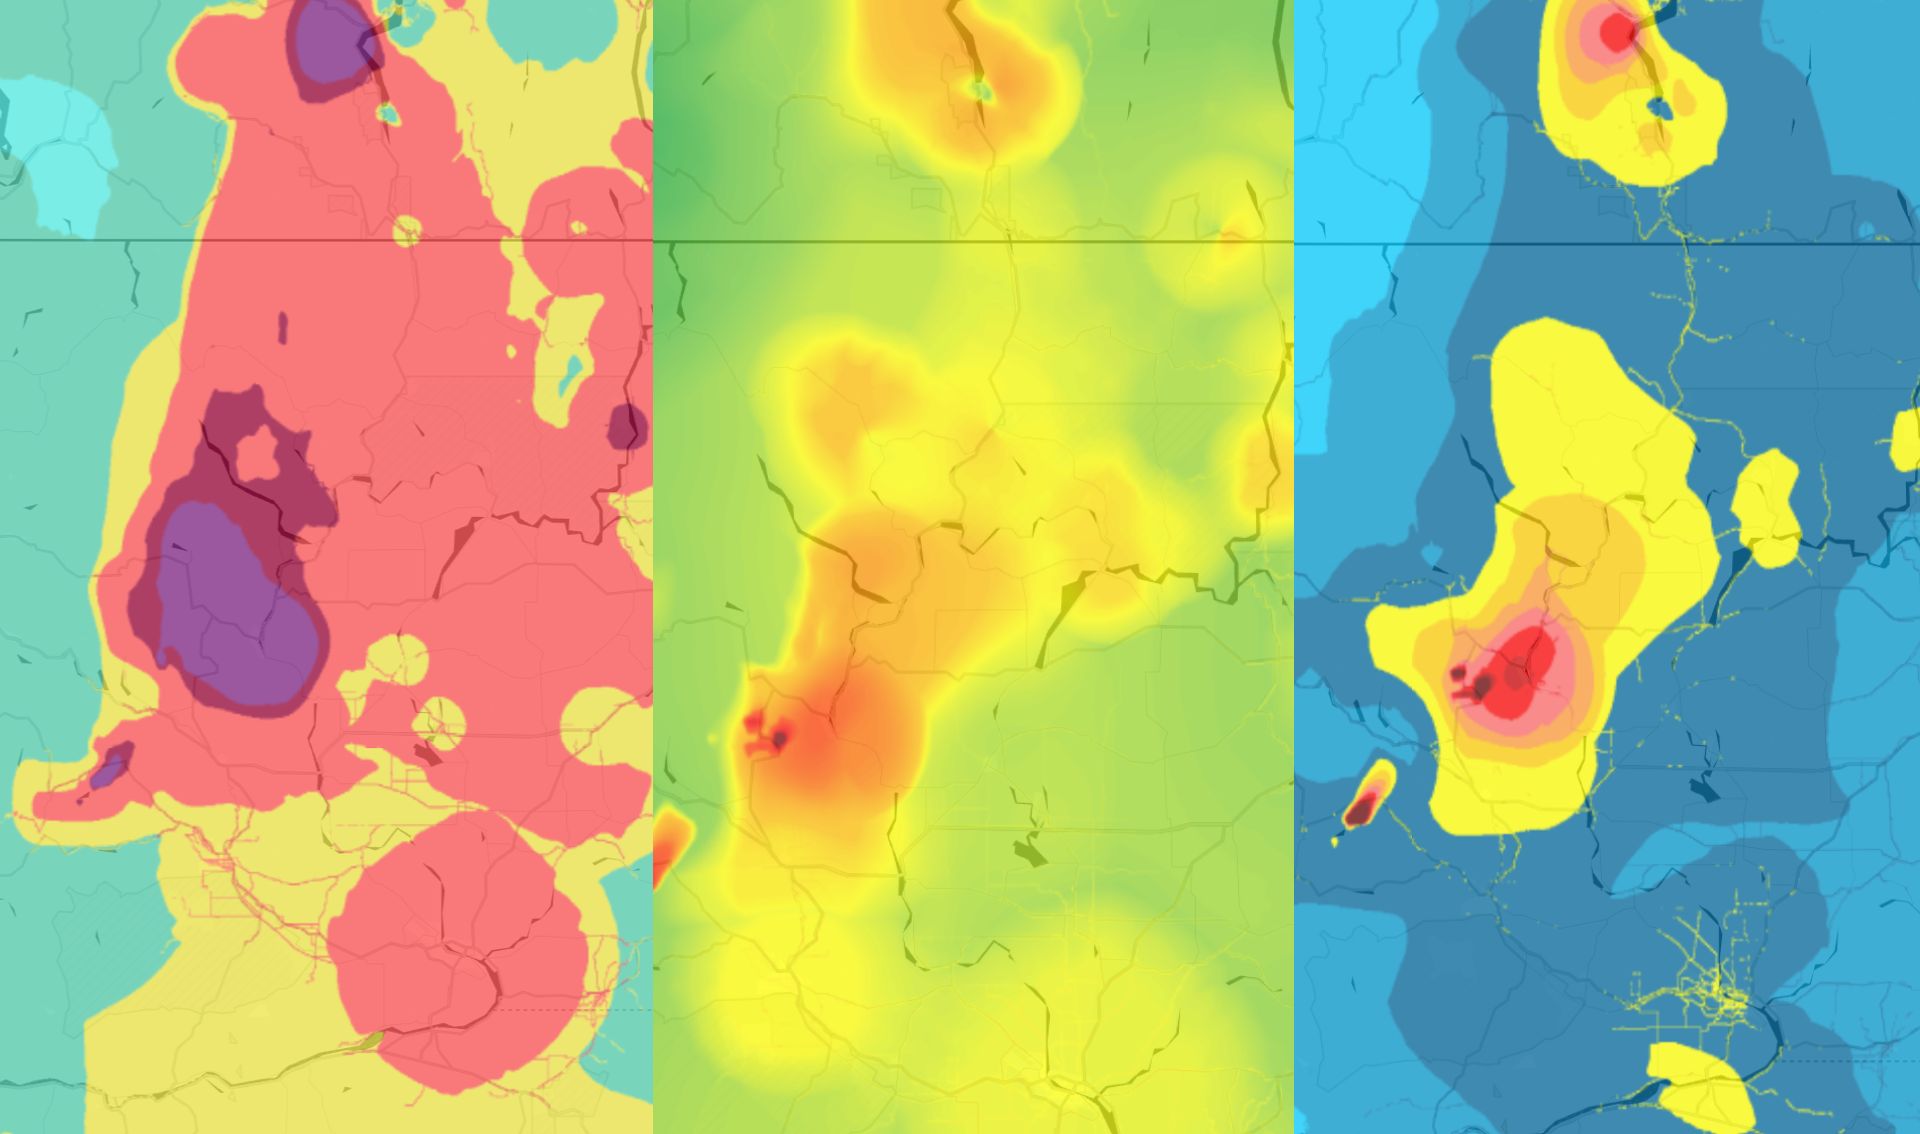
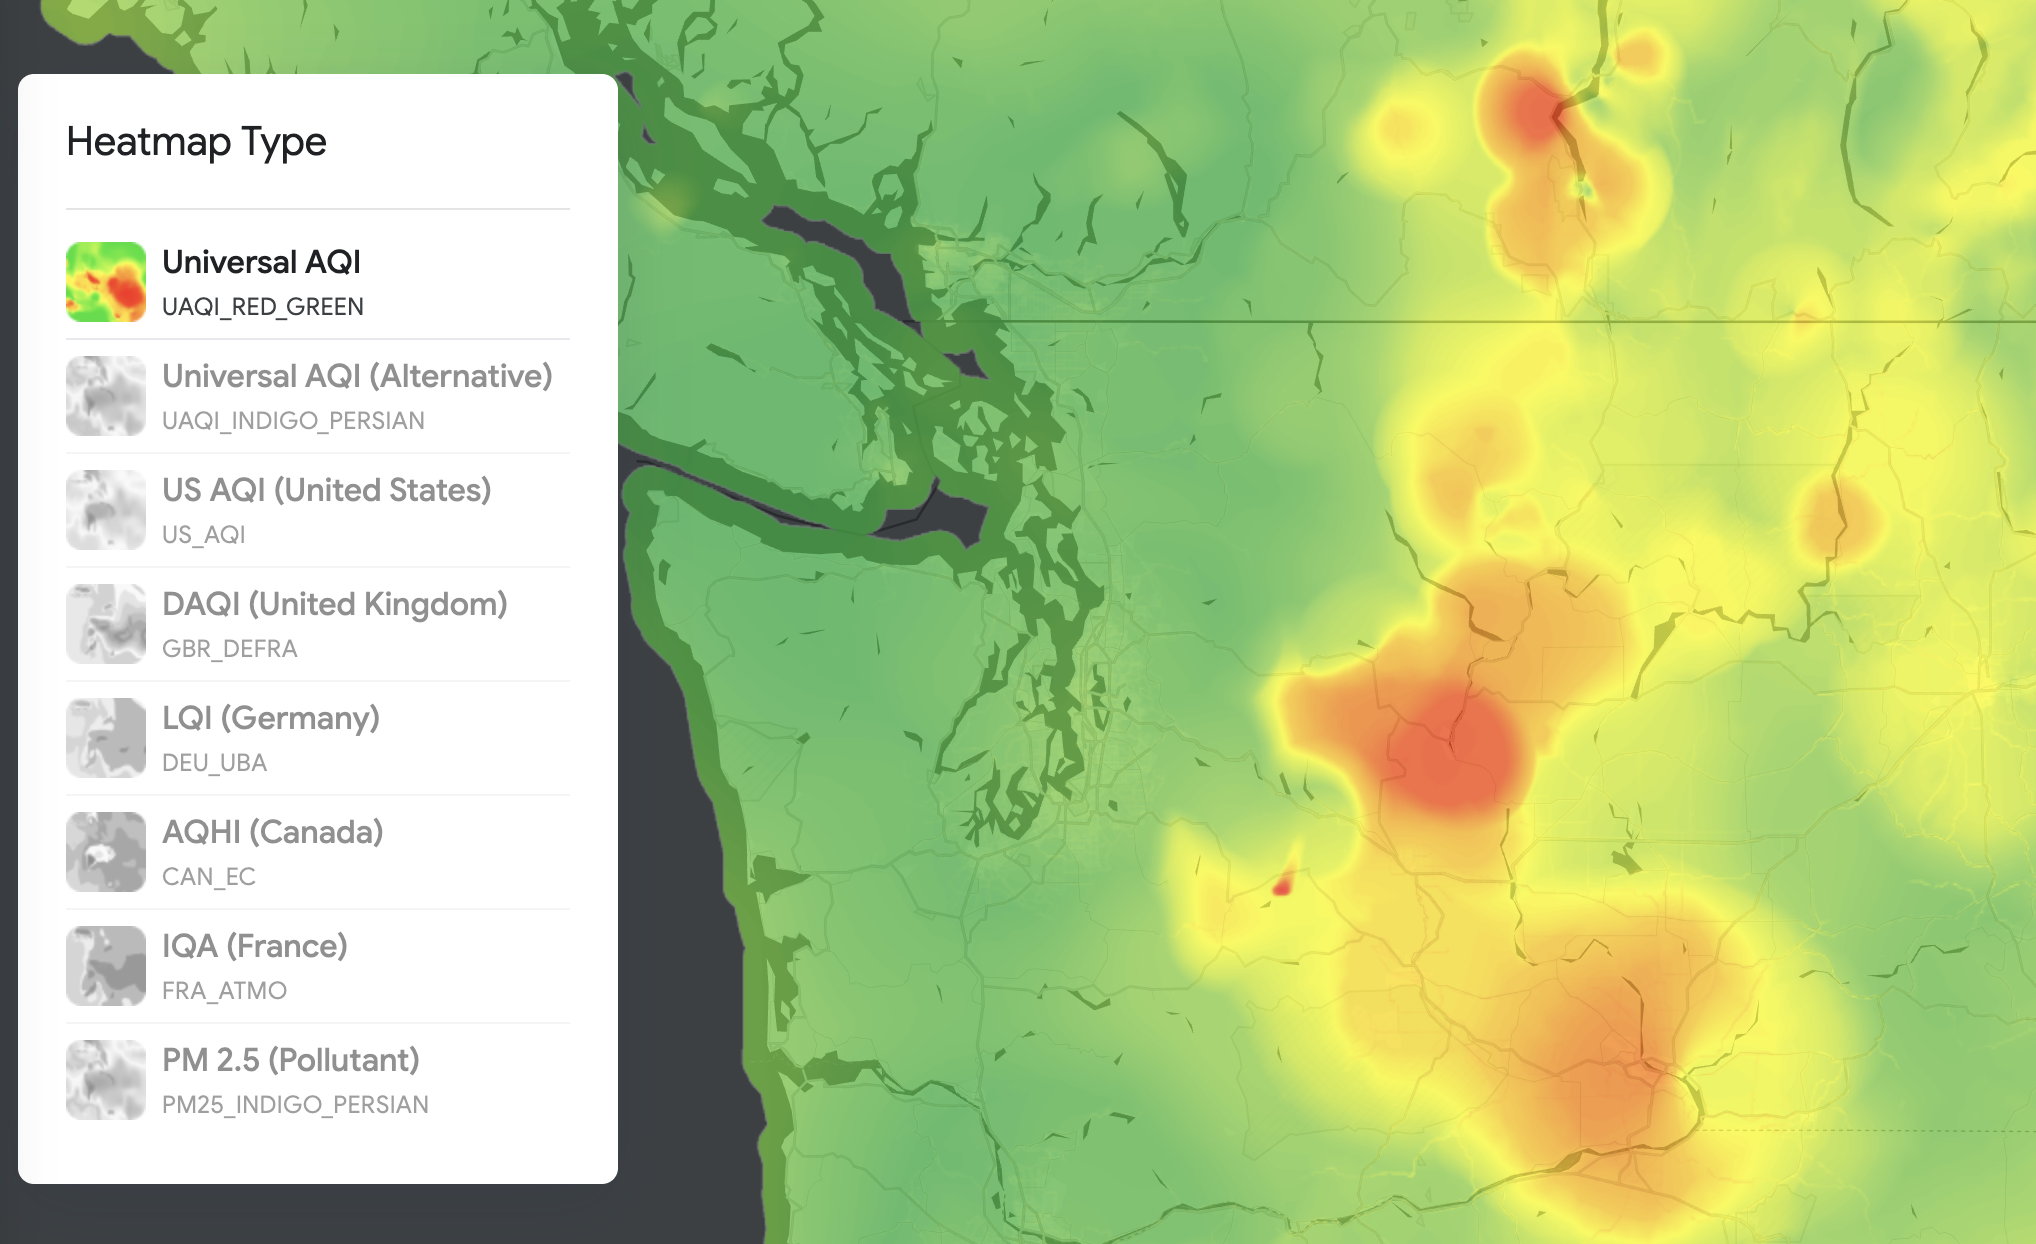
{TYPE} specifies the type of AQI heatmap to return. It can be one of:
- "UAQI_RED_GREEN" Universal Air Quality Index red-green.
- "UAQI_INDIGO_PERSIAN" Universal Air Quality Index indigo-persian.
- "PM25_INDIGO_PERSIAN" PM2.5 index indigo-persian.
- "GBR_DEFRA" Daily Air Quality Index (UK) color palette.
- "DEU_UBA" German Local Air Quality Index color palette.
- "CAN_EC" Canadian Air Quality Health Index color palette.
- "FRA_ATMO" France Air Quality Index color palette.
- "US_AQI" US Air Quality Index color palette.
Why should you care about what type of AQI heatmap your app uses? People are familiar with the AQI scale used in their own country, and each region has different pollutant thresholds and health standards. Displaying air quality data in the local AQI format helps build trust and makes your app more intuitive to use.
{Z} is the zoom level that determines how large or small the contents of a map appear in a map view. Allowed values are 0-16, where a value of 0 displays the entire world in a single tile.
{X} and {Y} are the coordinates of the tile to retrieve, relative to the north west corner (0,0). {X} values are increasing from west to east and {Y} values are increasing from north to south.
Endpoint: GET
https://airquality.googleapis.com/v1/mapTypes/UAQI_RED_GREEN/heatmapTiles/2/0/1?key={YOUR_API_KEY}
Response
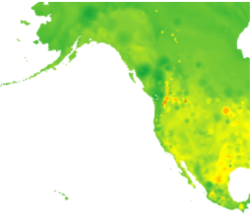
The tile appears as a .png image that can be used as a Google Map custom overlay. If you are using vanilla Javascript, this is easily done by specifying a new tile layer (aqLayer in the example below) and placing the overlay on top of the base map by map.overlayMapTypes.insertAt(0, aqLayer);.
<!doctype html>
<html>
  <head>
    <meta charset="utf-8" />
    <title>Air Quality Overlay</title>
    <style>#map{height:100vh;width:100vw;margin:0;padding:0;}</style>
    <script>
      let aqLayer;

      function initMap() {
        const map = new google.maps.Map(document.getElementById("map"), {
          center: { lat: 49.2827, lng: -123.1207 }, // Vancouver, tweak as needed
          zoom: 8,
          mapId: "DEMO_MAP_ID" // optional if you use Map IDs
        });

        // Choose your heatmap type (try: 'US_AQI', 'UAQI_RED_GREEN', 'PM25_INDIGO_PERSIAN', 'CAN_EC', etc.)
        const MAP_TYPE = "US_AQI";
        const API_KEY  = "YOUR_API_KEY";

        aqLayer = new google.maps.ImageMapType({
          tileSize: new google.maps.Size(256, 256),
          maxZoom: 16,
          minZoom: 0,
          name: `AirQuality:${MAP_TYPE}`,
          getTileUrl: (coord, zoom) =>
            `https://airquality.googleapis.com/v1/mapTypes/${MAP_TYPE}/heatmapTiles/${zoom}/${coord.x}/${coord.y}?key=${API_KEY}`,
        });

        // Put the overlay on top of the base map
        map.overlayMapTypes.insertAt(0, aqLayer);

        // Example: adjust opacity later if you want (0..1)
        // map.overlayMapTypes.getAt(0).setOpacity(0.6);
      }
      window.initMap = initMap;
    </script>
    <script async defer
      src="https://maps.googleapis.com/maps/api/js?key=YOUR_API_KEY&callback=initMap&v=weekly"></script>
  </head>
  <body><div id="map"></div></body>
</html>
What can the Google Air Quality API be used for?
Checking the air quality is now as routine, and as essential, as checking the weather. According to the World Health Organization, air pollution is one of the greatest environmental risks to human health. As the climate continues to change, concerns about the air we breathe will only grow. The API is ideal for three kinds of industries:
- Smart home & buildings: If your company builds internet-connected air purifiers, HVAC systems (like those from Nest, Honeywell, or Johnson Controls), or air quality monitors, the API offers a reliable alternative to on-device sensors, which can be costly and difficult to maintain. Instead of relying on local measurements that vary based on sensor placement, you can call the API to access accurate, location-based air quality data in real time.
- Travel & hospitality: Hotel chains can use the Air Quality API to help guests find destinations with clean air, adding a new layer of wellness focused filtering. Travel planning apps could go even further by recommending the best hotels, outdoor activities, and restaurants based on real time air quality conditions.
- Health & fitness: Apps and websites that help people discover, plan, and navigate outdoor activities - such as hiking, walking, running, and biking - can greatly enhance their value by integrating air quality information. Platforms like AllTrails, Strava, and similar outdoor fitness apps could use real time AQI data to help users choose safer, healthier routes and plan activities with confidence.
To start using the Google Air Quality API, you'll need to first enable it in the Google Cloud Console. Once you've created a Google Cloud project, find your way to the APIs & Services page and search for "air quality". The "Air Quality API" should show up as the first result. Click [Enable] to get access.
Google Air Quality API pricing
Pricing starts at $5.00 CPM (cost per thousand), the same price as the Google Routes API, which is used to retrieve the fastest route from Point A to B, and 30 times more expensive than the Google Weather API ($0.15 CPM), which is used to retrieve real time weather forecasts.
There's a free usage cap of 10,000 API calls per month and past that, calls are billed on a tiered basis.
| 0 - 10k | 10k - 100k | 100k - 500k | 500k - 1M | 1M - 5M | 5M+ | |
|---|---|---|---|---|---|---|
| Air Quality API | FREE | $5.00 | $4.00 | $2.00 | $0.50 | $0.25 |
As with other Google Maps services, working with a Google Maps Partner can provide access to discounted pricing at higher volumes.
What I think of the Google Air Quality API
The Google Air Quality API is an impressive piece of engineering. It aggregates data from a wide range of sources - including government monitoring stations, low-cost sensors, meteorological inputs, satellites, land cover, and live traffic data. This information is validated, processed through advanced air quality models, and made accessible via an API that allows developers to programmatically retrieve real-time air quality conditions around the world.
The biggest barrier to widespread adoption though is cost. Although the API is priced per request, most apps or connected devices need to call it multiple times a day - whenever a user opens the app, refreshes a page, or checks for updates. When you add up those requests, the total cost can quickly outweigh the value it provides, making it hard for companies to justify using it. The most likely customers for the API are smart home device manufacturers. However, since their revenue comes primarily from hardware sales, a per-request pricing model isn’t practical. For the Google Air Quality API to be a viable option, it would need to be offered under a per-device licensing agreement instead.
👋 As always, if you have any questions or suggestions for me, please reach out or say hello on LinkedIn.